Hyperbole comes in many forms. This article in Scientific American came with a full page artist's rendering of a "future hurricane." I have shown a very small (to avoid copyright lawyers) copy of the picture below, with a blow up of one section. The caption for the picture in the magazine says "Future hurricanes could be more severe thanks to global warming." The blow up shows a giant hurricane bearing down on the Mediterranean and the East coast of the United States

Figure 1. The small picture at the left is a miniature version of the 8 inch by 11 inch full page artist's rendering of a "future hurricane" form page 44 of the July 2007 Scientific American. The right side shows a blow up of part of the picture.
The very first paragraph of the article reminds the reader of the 2005 hurricane season and, of course, Katrina. So, I use a pair of pictures below to compare Katrina to the imagined "future hurricane." The first is a satellite image of Katrina shortly before it made landfall near New Orleans. The second is a detail of the Scientific American picture. Note that the sizes of the images have been adjusted to give the same scale.

Figure 2. Detail of Scientific American picture of "future hurricane" with same scale as image of Hurricane Katrina in figure 3,below.
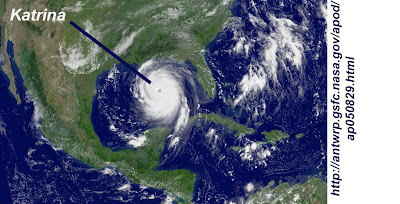
Figures 3. Satellite image of Hurricane Katrina just hours before making landfall at New Orleans. This image is on the same scale at the artist rendering of a "future hurricane" in figure 2, above.

Figure 4. Juxtaposition of the Scientific American "future hurricane" and the very real Katrina from the satellite image. I have removed land masses from both pictures. Both pictures are on the same scale, as in figures 2 & 3.
Scientific American's "future hurricane" is bigger than the continent of North America. It is so big that it stretches from northern Brazil to southern Canada. It is as large as the North Atlantic Ocean. This is clearly extreme visual hyperbole, but it is also a metaphor for much of the global warming debate, where preposterous exaggerations and extrapolations abound.
Those who are convinced that we are headed for a future of giant hurricanes due to increased CO2 might consider the following journal articles to mitigate the effects of the seemingly endless fear mongering so common in the global warming debate:
1. In Low Atlantic hurricane activity in the 1970s and1980s compared to the past 270 years, Nyberg, et. al., point out that "reliable observations of hurricane activity in the North Atlantic only cover the past few decades." It is not possible to say, based on this short set of data, if the variation that has been seen during these few decades is greater than should be expected over longer time scales. However, they developed a proxy for both sea surface temperature and vertical wind shear covering 270 years. (Vertical wind shear is inversely related to hurricane formation). The result shows that "the average frequency of major hurricanes decreased gradually from the 1760s until the early 1990s, reaching anomalously low values during the 1970s and 1980s." It seems clear that the upswing in hurricane activity seen from the beginning of the satellite era to the present is largely a consequence of the beginning of the satellite era being at the low point of hurricane activity for the last 270 years.
2. The article in Nature, Intense hurricane activity over the past 5,000 years controlled by El Nin˜o and the West African monsoon," by Donnelly and Woodruff of the Woods Hole Oceanographic Institution in Massachusetts echos the concern that "the instrumental record is too short and unreliable to reveal trends in intense tropical cyclone activity." To overcome these limitations they used sediment deposits in coastal lagoons of the Caribbean to gauge hurricane activity on the century and millennial time scales over a 5000 year period. They found the frequency of intense hurricanes varied widely on these time scales during the past 5,000 years and that the frequency appears to be governed by the El Nin˜o/Southern Oscillation and the strength of the West African monsoon." Additionally, " sea surface temperatures as high as at present are not necessary to support intervals of frequent intense hurricanes."
3. The short instrumental record of hurricane activity was a motivation for Miller, et. al. in their 2006 Proceedings of the National Academy of Sciences paper, "Tree-ring isotope records of tropical cyclone activity." As trees grow, the oxygen isotope ratios of the water at that place and time are locked into their rings. It is also known that the precipitation of tropical cyclones and hurricanes have oxygen isotope ratios that are greatly different that more common causes of precipitation. Miller, et. al., examined long leaf pines (pinus pulustris) in Georgia because they have shallow roots and a distinct early season growth and late season growth in their rings. these combine to give a precise temporal fix on isotope ratio variation. Their study covered 1770 to 1990. Their analysis of the tree ring oxygen isotope data shows very close agreement with the instrumental data for the southeastern United States after 1940, verifying the efficacy of their method for earlier times. The overall results indicate "systematic, decadal- to multidecadal-scale variations" in the isotope ratios, and consequently variations in the number of hurricanes. Hurricane activity appears to have peaked in the 1770s, 1800s to 1820s, 1840s and 1850s, 1865 to 1880, and the 1940s to 1950s. The quietest decades are the 1780s through 1790s, and the 1970s. The 1970s saw the beginning of satellite tracking of hurricanes. The fact that there has been an upswing in hurricanes in the satellite record is much less alarming when you consider that the 1970s was one of the least active decades (at least for the southeastern United States) in over 200 years.
Kevin E. Trenberth, "Warmer Oceans, Stronger Hurricanes," Scientific American, July 2007, p44-51. (Get copy here.)
Johan Nyberg, et. al., "Low Atlantic hurricane activity in the 1970s and 1980s compared to the past 270 years," Science, Vol 447, 2007. (Get copy here.)
Jeffrey P. Donnelly & Jonathan D. Woodruff, "Intense hurricane activity over the past 5,000 years controlled by El Nin˜o and the West African monsoon," Nature, Vol 447, 24 May 2007 (Get copy here.)
Dana L. Miller, et. al., "Tree-ring isotope records of tropical cyclone activity," Proceedings of the National Academy of Sciences, PNAS, Vol. 103, no. 39, September 26, 2006 (Get copy here.)


