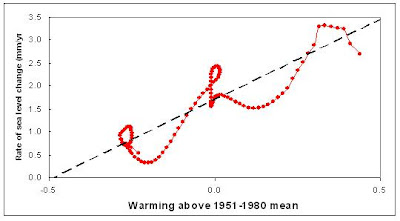
Critique #1. Sea level rise rate vs. temperature is displayed in a way that erroneously implies that it is well fit to a line.
Rahmstorf's figure 2 shows the sea level rise rate vs. temperature in the form of 24 discreet points. These points are derived by binning the 120 points that represent each individual year from 1880 to 2000 into groups of 5 after smoothing the sea level data (Church, 2006) and temperature data (GISS) with with a nonlinear trend technique. My digitized version of his plot is shown in figure 1, below.
I smoothed the same sea level data and temperature data with a 15 year FWHM Gaussian filter. Note that the difference between smoothing the sea level data with the nonlinear trend line technique and with the Gaussian filter is vanishingly small, as demonstrated by the fact that I derived the same sea level rise rate vs. temperature as Rahmstorf does (sea level =3.375 *(T anomaly + 1.684, r = 0.86). My plot of sea level rise rate vs. temperature anomaly, which is very similar to Rahmstorf's, is shown below in figure 2. One might plausibly argue that the points in figures 1 and 2 could be reasonably fit to a line. That is precisely the argument that Rahmstorf makes.
However, if the data is not binned, that is, all 120 data points are shown, then it becomes perfectly clear that fitting this data to a line is entirely inappropriate. Figure 3, below, shows the same data as figure 2, without binning.
Rahmstorf seems to justify fitting this very non-linear data to a line by saying "A highly significant correlation of global temperature and the rate of sea-level rise is found (r = 0.88, P = 1.6 × 10⁻⁸) (Fig. 2) with a slope of a = 3.4 mm/year per °C." It should be understood that this is very poor justification. Section 4.4.4 of the The National Institute of Standards and Technology (NIST) Engineering Statistics Handbook says:
Model validation is possibly the most important step in the model building sequence. It is also one of the most overlooked. Often the validation of a model seems to consist of nothing more than quoting the R^2 statistic from the fit (which measures the fraction of the total variability in the response that is accounted for by the model). Unfortunately, a high R^2 value does not guarantee that the model fits the data well. Use of a model that does not fit the data well cannot provide good answers to the underlying engineering or scientific questions under investigation.
Back to series of posts concerning Problems with the Rahmstorf (2007) paper.
1. GISS: http://data.giss.nasa.gov/gistemp/
2. J. A. Church, N. J. White, Geophys. Res. Lett. 33, L01602 (2006).
3. Rahmstorf, A Semi-Empirical Approach to Projecting Sea Level Rise, Science 315, 368 (2007)
Back to series of posts concerning Problems with the Rahmstorf (2007) paper.


No comments:
Post a Comment