Showing posts with label sea level. Show all posts

Rahmstorf's sea level rise rate vs. T does not fit a line

This is part of a series of posts concerning Problems with the Rahmstorf (2007) paper.

Critique #1. Sea level rise rate vs. temperature is displayed in a way that erroneously implies that it is well fit to a line.

Rahmstorf's figure 2 shows the sea level rise rate vs. temperature in the form of 24 discreet points. These points are derived by binning the 120 points that represent each individual year from 1880 to 2000 into groups of 5 after smoothing the sea level data (Church, 2006) and temperature data (GISS) with with a nonlinear trend technique. My digitized version of his plot is shown in figure 1, below.


Figure 1. Rahmstorf's version of sea level rise rate (mm/year) vs. temperature anomaly.

I smoothed the same sea level data and temperature data with a 15 year FWHM Gaussian filter. Note that the difference between smoothing the sea level data with the nonlinear trend line technique and with the Gaussian filter is vanishingly small, as demonstrated by the fact that I derived the same sea level rise rate vs. temperature as Rahmstorf does (sea level =3.375 *(T anomaly + 1.684, r = 0.86). My plot of sea level rise rate vs. temperature anomaly, which is very similar to Rahmstorf's, is shown below in figure 2. One might plausibly argue that the points in figures 1 and 2 could be reasonably fit to a line. That is precisely the argument that Rahmstorf makes.

Figure 2. Moriarty's version of sea level rise rate vs. temperature anomaly.

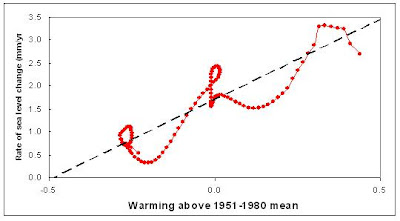
However, if the data is not binned, that is, all 120 data points are shown, then it becomes perfectly clear that fitting this data to a line is entirely inappropriate. Figure 3, below, shows the same data as figure 2, without binning.

Figure 3. When the sea level rise rate vs temperature anomaly data is not binned it appears that fitting it to a line is entirely inappropriate.


Rahmstorf seems to justify fitting this very non-linear data to a line by saying "A highly significant correlation of global temperature and the rate of sea-level rise is found (r = 0.88, P = 1.6 × 10⁻⁸) (Fig. 2) with a slope of a = 3.4 mm/year per °C." It should be understood that this is very poor justification. Section 4.4.4 of the The National Institute of Standards and Technology (NIST) Engineering Statistics Handbook says:


Model validation is possibly the most important step in the model building sequence. It is also one of the most overlooked. Often the validation of a model seems to consist of nothing more than quoting the R^2 statistic from the fit (which measures the fraction of the total variability in the response that is accounted for by the model). Unfortunately, a high R^2 value does not guarantee that the model fits the data well. Use of a model that does not fit the data well cannot provide good answers to the underlying engineering or scientific questions under investigation.


Back to series of posts concerning Problems with the Rahmstorf (2007) paper.

1. GISS: http://data.giss.nasa.gov/gistemp/
2. J. A. Church, N. J. White, Geophys. Res. Lett. 33, L01602 (2006).
3. Rahmstorf, A Semi-Empirical Approach to Projecting Sea Level Rise, Science 315, 368 (2007)

Back to series of posts concerning Problems with the Rahmstorf (2007) paper.

Critique of "A Semi-Empirical Approach to Projecting Future Sea-Level Rise" by Rahmstorf

A recent article in Science by Stefan Rahmstorf (2007) predicted extreme sea level rise during the 21st century. Rahmstorf's predictions went as high as 140 cm (55 inches), far beyond even the high edge of the uncertainty of the IPCC's unlikely A1Fl scenario (see here, page 820). This high estimate by the IPCC was 59cm (23 inches), with other other scenarios yielding considerably lower estimates. Following is a critique of Rahmstorf's method and conclusions.

This post has a quick summary of Rahmstorf's approach to to projecting sea-level rise for this century. Following that summary is a quick list of problems that I have identified in his paper, each with a link to subsequent posts with more detailed information.


Rahmstorf's Simple Model


Rahmstorf's simple model of sea level rise consists of a system in equilibrium, where the sea level and the temperature start out as constants. Then an instantaneous step occurs in the temperature, causing the sea level to rise. Eventually the sea level will rise to a new equilibrium, as shown below.


It is very important to note that the time required to arrive at the new equilibrium is, according to Rahmstorf, "to be on the order of millennia." This long time scale provides the other important point of this simple model. That is, over a short enough time scale the rate of sea level rise can be considered a constant (as illustrated in the above graph during the time where dH/dT is proportional to delta T). Rahmstorf posits that "this linear approximation may be valid for a few centuries."

Therefore, in this model, a temperature jump in the 1920s, for example, would result in a sea level rising at a constant rate for several hundred years, even without any subsequent temperature increases. Of course, subsequent temperature rises would each result in a greater sea level rise rate, but there would never be any drop in the rise rate for several hundred years, assuming no significant drops in the temperature. The following section puts this model on a mathematical footing.


Rahmstorf's Mathematical Strategy

1) Assume that the rate of sea level rise rate at any given time is proportional to the deviation form some global equilibrium temperature at that time. He expresses this in the following formula...


where H is the sea level, dH/dt is the sea level rise rate, T is the temperature, To is the the equilibrium temperature, and a is the constant of proportionality.

2) To and a can be derived by simply plotting dH/dt vs T and fitting to a line.

3) Once To and a have been determined, then the sea level for any given time, H(t), can be calculated by integrating equation (I), above, with respect to time...


4) By applying various temperature rise scenarios for the 21st century to equation (II), Rahmstorf predicts the sea level for the hear 2100 (H(2100)).


Problems with this model

1) Sea level rise rate vs. temperature is displayed in a way that erroneously implies that it is well fit to a line, as expressed in equation I, above. More...

2) The assumption that the time required to arrive at the new equilibrium is "on the order or millennia" is not borne out by the data. More...

3)Rahmstorf extrapolates out more than five times the measured temperature domain. More...

_________________________________________________
A Semi-Empirical Approach to Projecting Future Sea-Level Rise," Rahmstorf, Science, Vol 315, 2007

Overview
Rahmstorf's sea level rise rate vs.T does not fit a line
Time for sea level to reach equilibrium is not millennia
Rahmstorf extrapolates out more than five times the measured temperature domain
_________________________________________________